US climate targets show not all pledges are created equal

President Joe Biden’s pledge to cut US greenhouse gas emissions in half by 2030 will still leave the country with more emissions per capita by the time the target is reached than any of the world’s largest polluters making commitments for the same date.
The Paris climate accord allows countries that have signed up to the agreement to set their own parameters for iterative emissions objectives, through legally binding targets that are known as Nationally Determined Contributions.
These commitments allow developing countries to design pledges which account for the acceleration in their economic growth. But the lack of a common structure makes individual country commitments difficult to compare.
China and India have linked their targets to measures of emissions intensity rather than absolute levels. Intensity is measured per unit of gross domestic product.
Individual pledges also use differing baseline years. The result means that headline figures for percentage emissions reductions by 2030 may sound impressive, but do not equate.
Most countries set their targets from a peak. Japan’s greenhouse gas emissions, for example, hit a record of more than 1.4bn tonnes of carbon dioxide equivalent in 2013, according to figures from Climate Action Tracker. This was after the Fukushima disaster led to temporary closures of nuclear power plants and the country’s reliance on fossil fuels increased.
The Suga government has set its sights on reducing emissions from that date by 46 per cent by 2030 — although an updated NDC has not yet been formally submitted.
The UK, on the other hand, measures its target from a much earlier date of 1990 — one year before its greenhouse emissions peaked at 794m tonnes.
“For some countries, there’s some element of [manipulation],” said Niklas Höhne, founding partner of the NewClimate Institute, a non-profit think-tank which is behind the Climate Action Tracker project. “The US has used the base year 2005 because that’s the year with the highest emissions, [from which] you get the highest reduction. There’s a natural tendency to propose [targets] in the way that makes it looks positive.”
Using historic baseline years means a certain share of the climate goals have already been achieved by each country, making it unclear which countries are making the most ambitious promises to reduce human impact on the climate, from today’s levels.

The US has already reduced greenhouse gas emissions from its 2005 reference year — excluding changes attributed to land use and forestry — by more than 11 per cent, according to analysis of data produced by the Climate Watch project of the non-profit World Resources Institute.
The same measure of those greenhouse gas emissions in the EU is down more than 20 per cent, towards its target of 55 per cent from 1990, while the UK’s carbon equivalent emissions are down more than 40 per cent from the same year, against an overall aim for a 78 per cent drop by 2035.
The US and the EU include atmospheric changes from land use and forestry in their overall targets, but this has been excluded from the FT’s analysis in order to compare the commitments on a like-for-like basis.
Emission intensity targets set by China and India use a baseline year of 2005. China’s target is linked not to all greenhouse emissions but only to carbon emissions, which make up 83 per cent of its overall emissions. Relative to real GDP, carbon emissions have fallen for both countries since 2005.
Figures from the International Energy Agency, which advises governments on energy policy, show that, by 2018, China’s C02 emissions — as a ratio to overall economic output — had dropped more than 40 per cent from 2005 levels. India’s had been reduced almost 10 per cent.
Yet, due to substantial economic expansion, headline greenhouse gas emissions have increased more than 70 per cent over the same time period for both countries.
German chancellor Angela Merkel acknowledged the confusion that different baseline years adds to tracing net zero pledges, at the St Petersburg climate dialogue she led on Thursday.
“It would be good if we could all actually agree on the same kind of base that we start from . . . the yardstick by which we judge our progress . . . [countries] ought to come to an agreement there,” the chancellor said.

Expressing current targets as absolute emissions levels expected in 2030 — on a country-wide and per capita basis — brings some clarity as to where national contributions to the global carbon budget should be by the end of the decade.
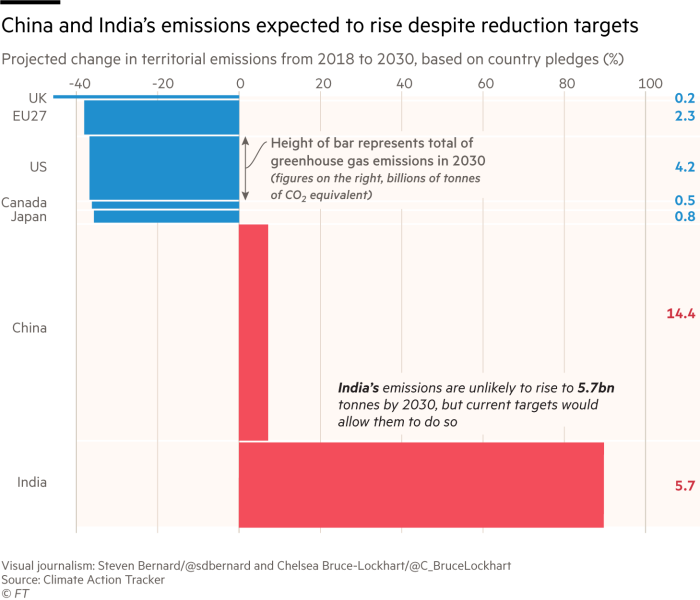
Analysis of the minimum targets laid out in each NDC commitment, by Climate Action Tracker, indicates that 2030 headline emissions for the US, Canada, Japan and the EU should be around 35 to 39 per cent lower than they were in 2018.
The UK has pushed for a quicker reduction in emissions — aiming for a 46 per cent fall from 2018 levels by 2030, assuming an even distribution of change over the years to its 2035 target.
Over the same period, China and India’s emissions could rise 7 per cent and 90 per cent respectively — although India is not expected to experience such a surge in emissions over a relatively short timeframe; current climate policies would already bring emissions well within its target in 2030, according to Climate Action Tracker’s analysis.
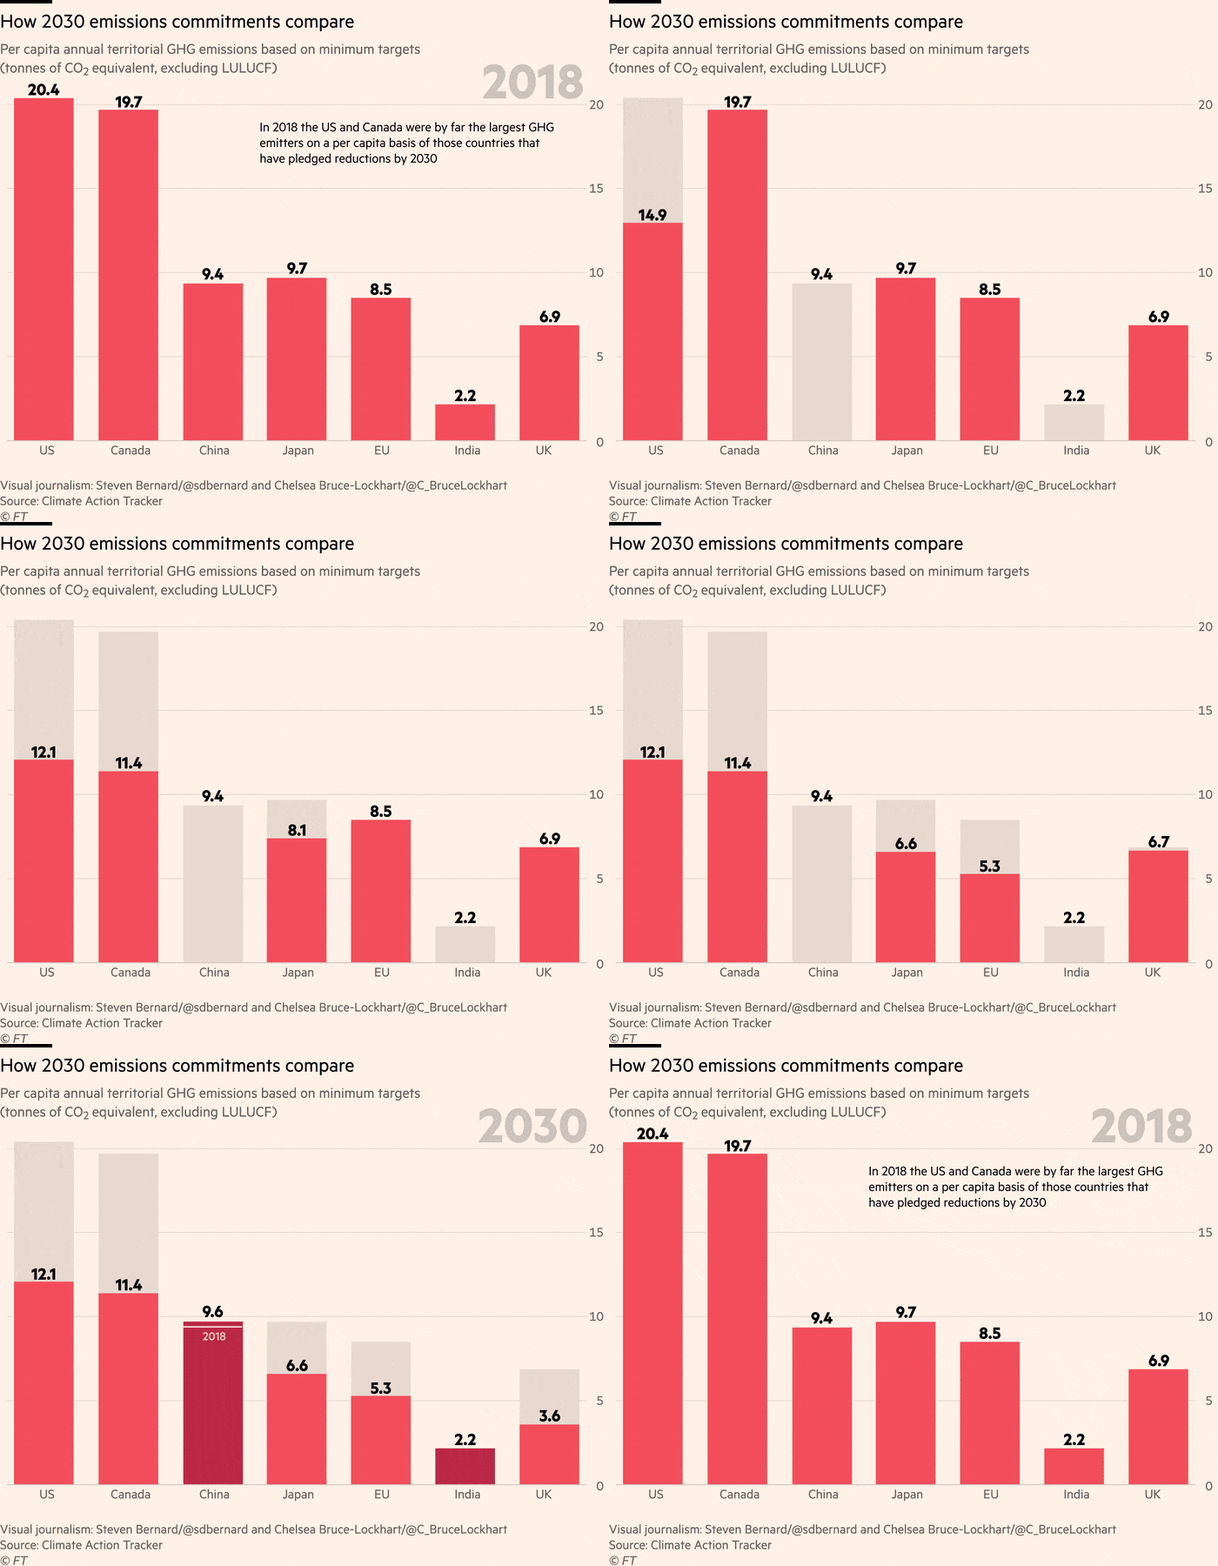
On a per capita basis, the ambition to reduce overall US emissions by at least 50 per cent by 2030 would cut carbon dioxide equivalent emissions to 12.1 tonnes per person by 2030, according to the figures from the Climate Action Tracker — still well above those of the EU and China.
“The US are starting from such a high point, historically . . . It’s much more difficult for them to change,” Höhne noted. “Emissions are already twice as high, per capita, than in the EU . . . despite having a similar economic [output].”
Meanwhile, China’s commitment to curb the intensity of its carbon emissions by 65 per cent, relative to the size of its economy, would allow per capita equivalent CO2 emissions to rise to 9.8 tonnes by 2030 from 9.4 tonnes in 2018. The increase takes into account China’s substantial economic growth expected over the next decade, even following the shock of the Covid-19 pandemic.
Follow @ftclimate on Instagram
Climate Capital

Where climate change meets business, markets and politics. Explore the FT’s coverage here